
Live on TradingView

Trade smarter
Win consistently

Professional-grade indicators for TradingView — classics rebuilt with adaptive logic, divergence detection and real signal statistics. The Essentials are free and open source.

Get the free indicators See how it works →
Newsletter
Weekly setups & new indicators in your inbox
Free
The Essentials
100%
Open source
Weekly
New scripts
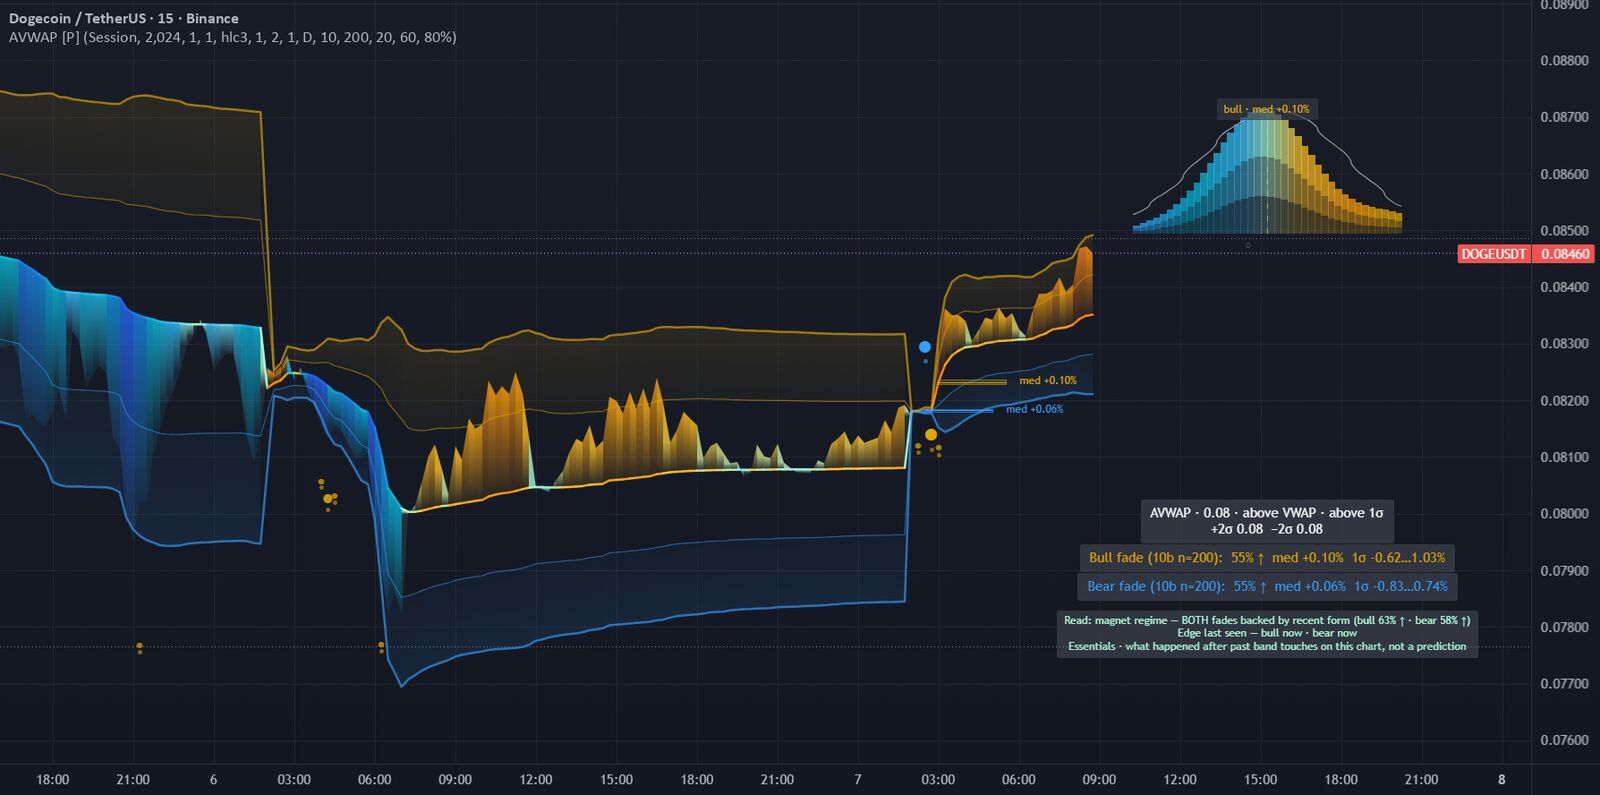
Anchored VWAP Magnetized
Volume-weighted average price from any anchor, with ±1σ and ±2σ deviation bands.
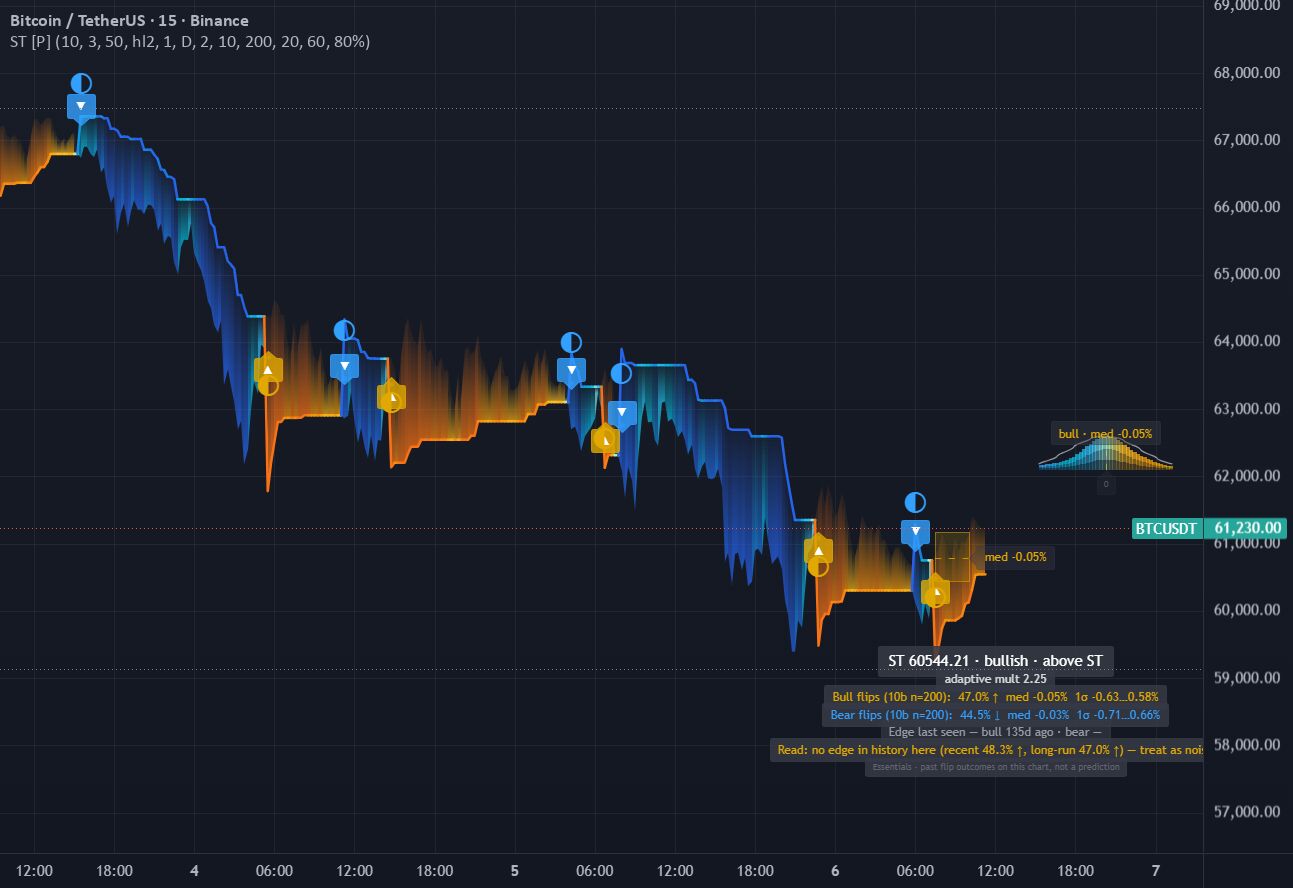
Supertrend Tempered
Supertrend Tempered
ATR-adaptive trend direction — the flip is the signal, whipsaws tempered.
MACD Rewired
MACD Rewired
The canonical MACD with a 4-state histogram, divergences and signal statistics.
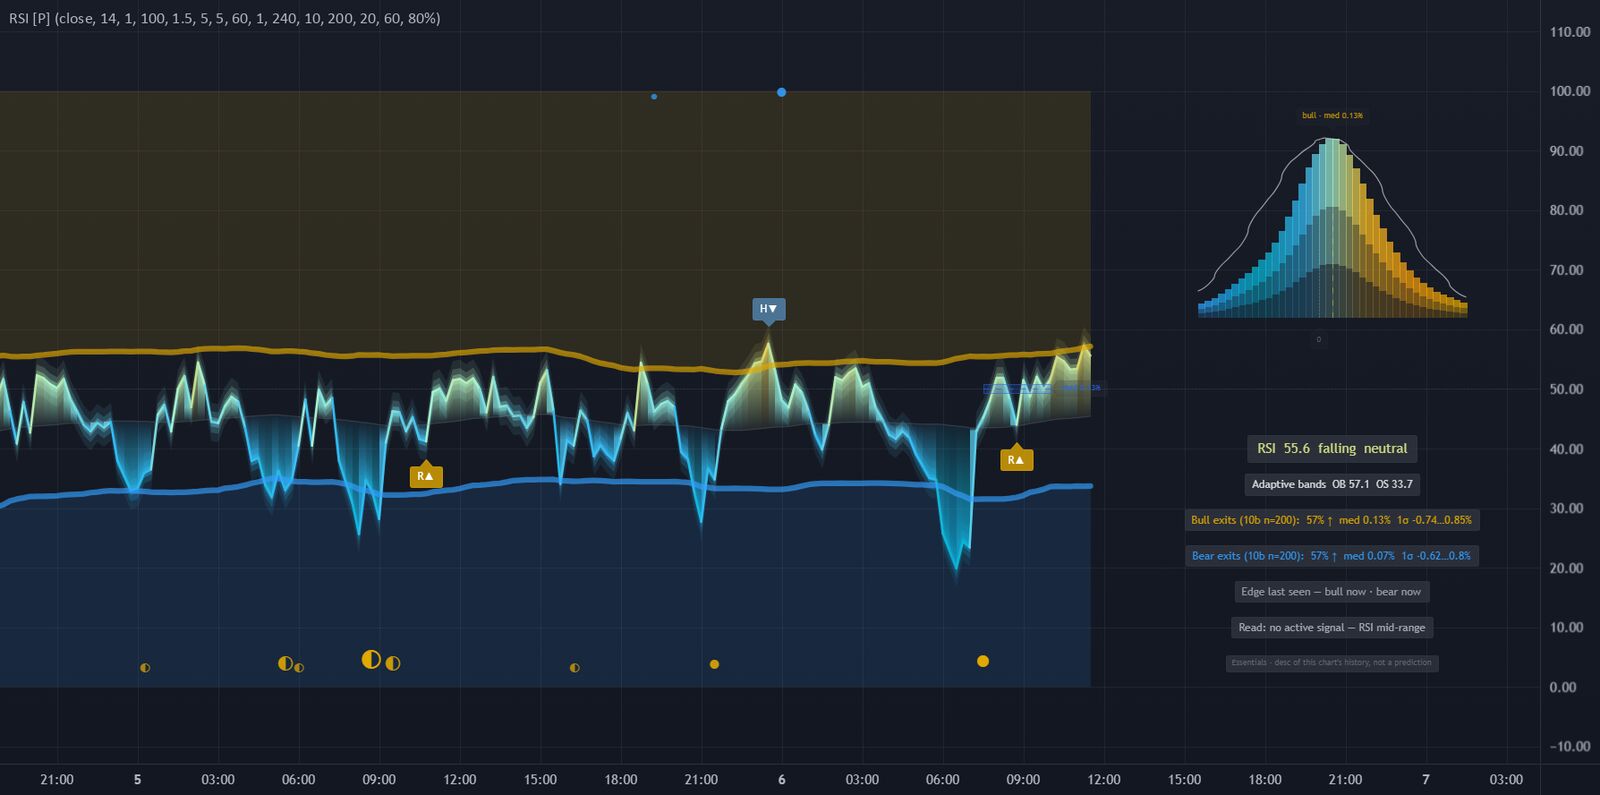
RSI Reforged
RSI Reforged
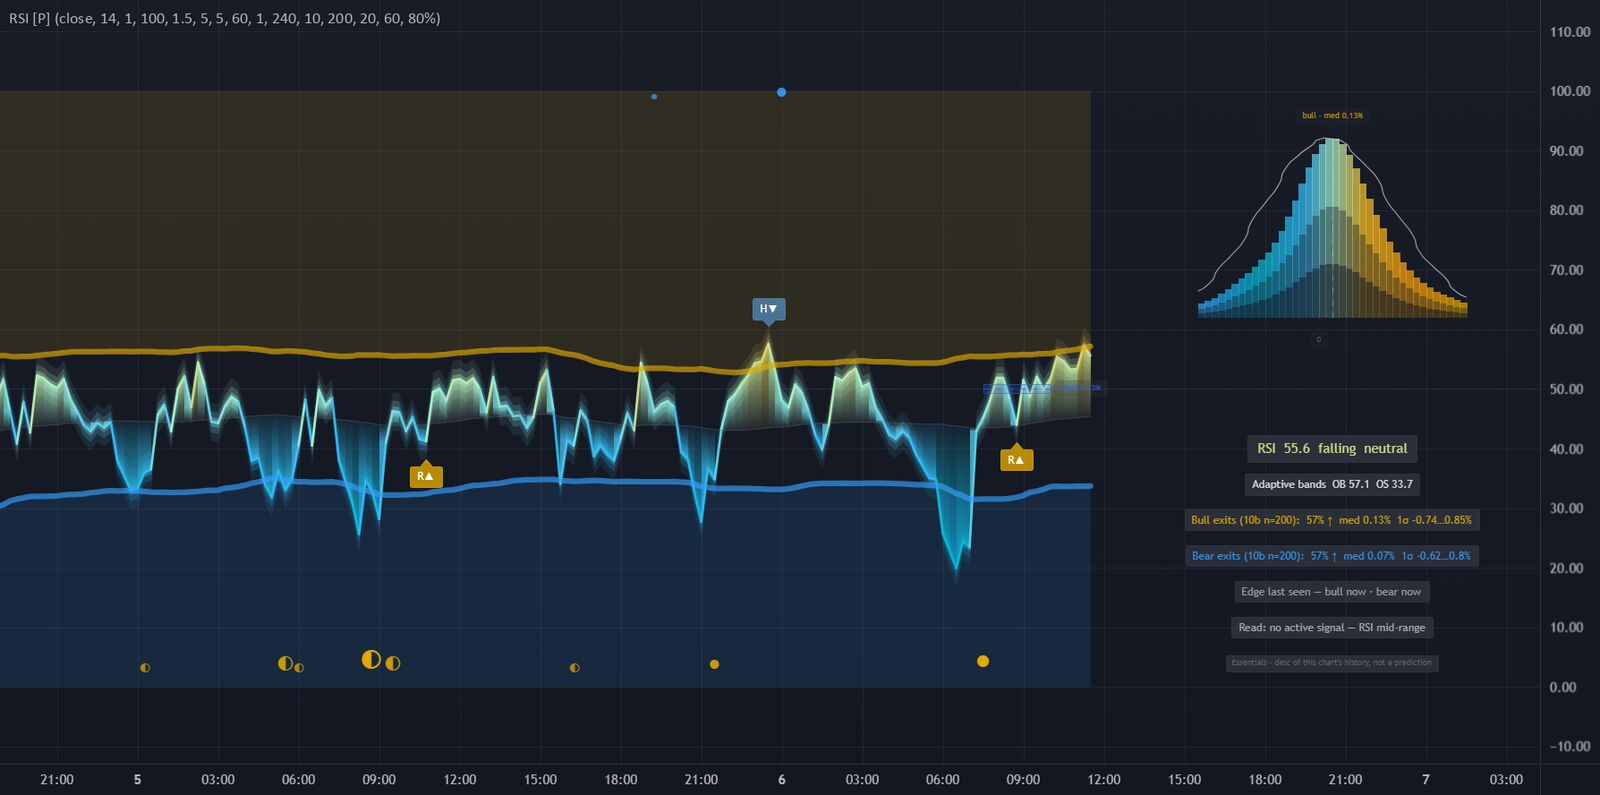
Wilder's RSI with adaptive bands, divergence detection and real signal statistics.
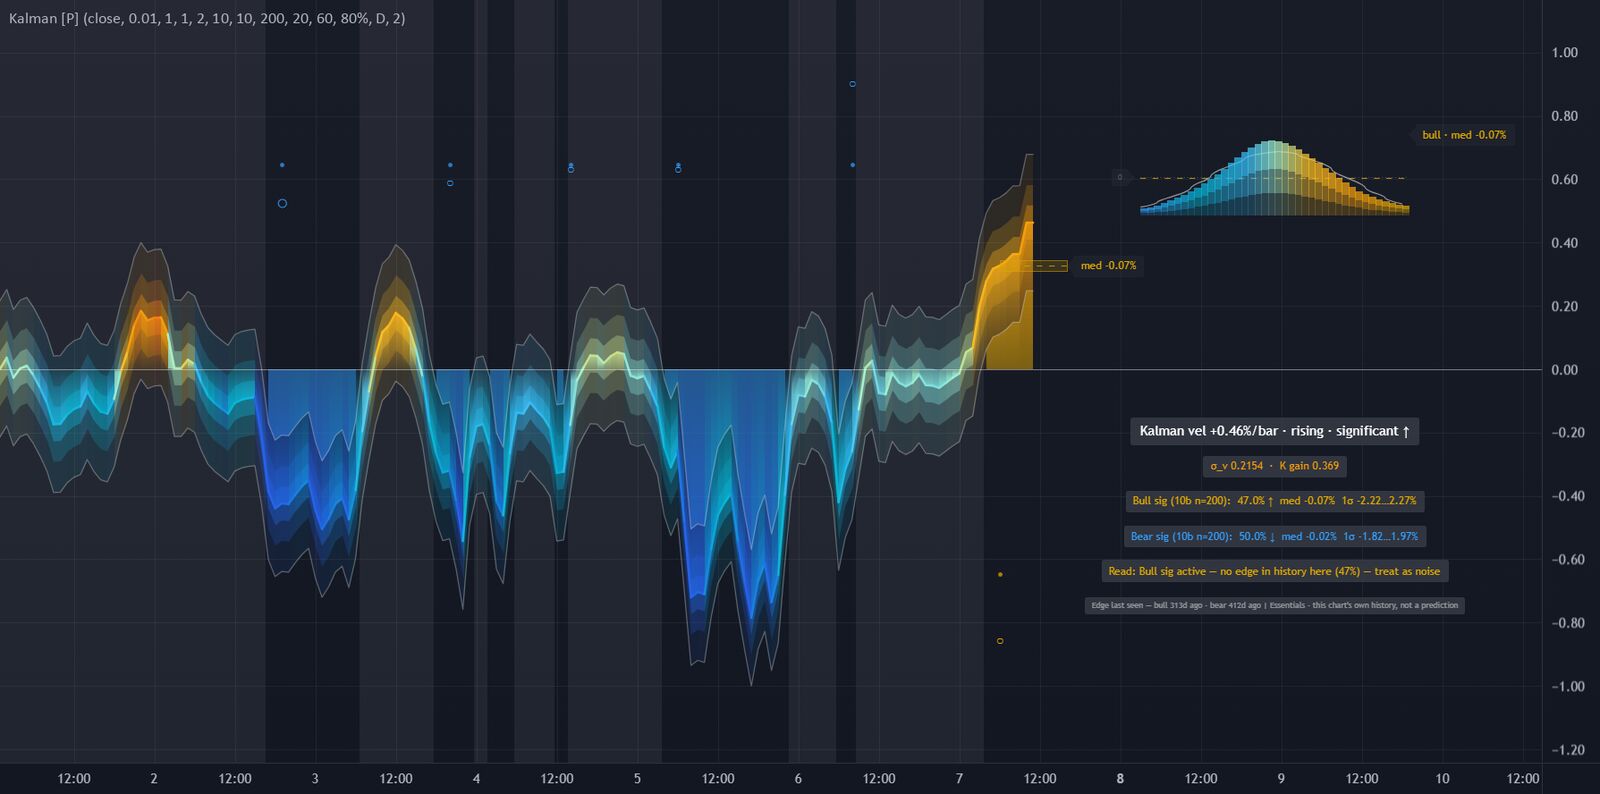
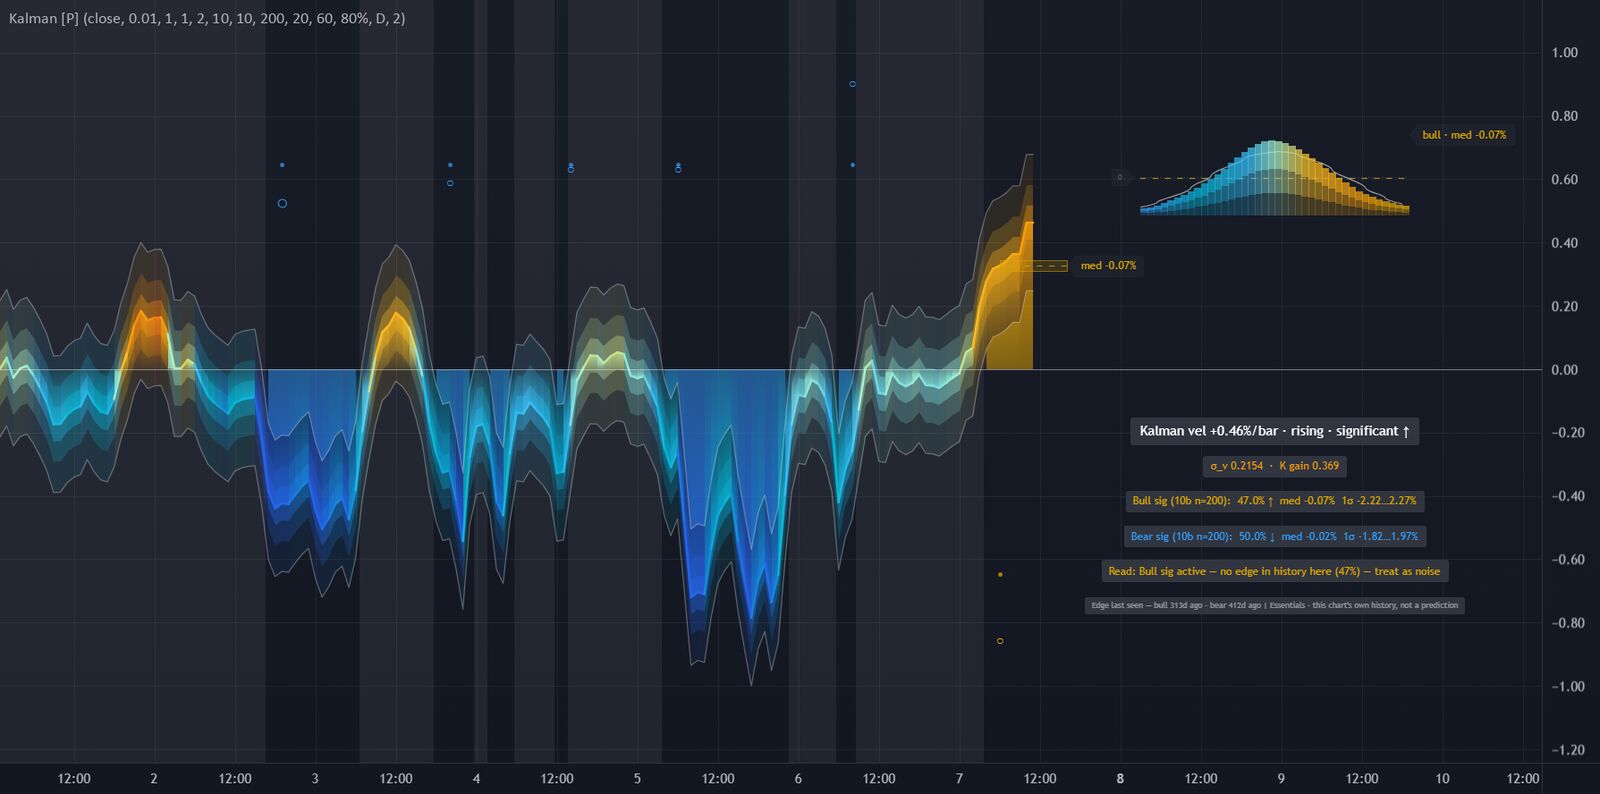
Kalman Trend Velocity
A real two-state Kalman filter — trend velocity with an uncertainty band that separates signal from noise.
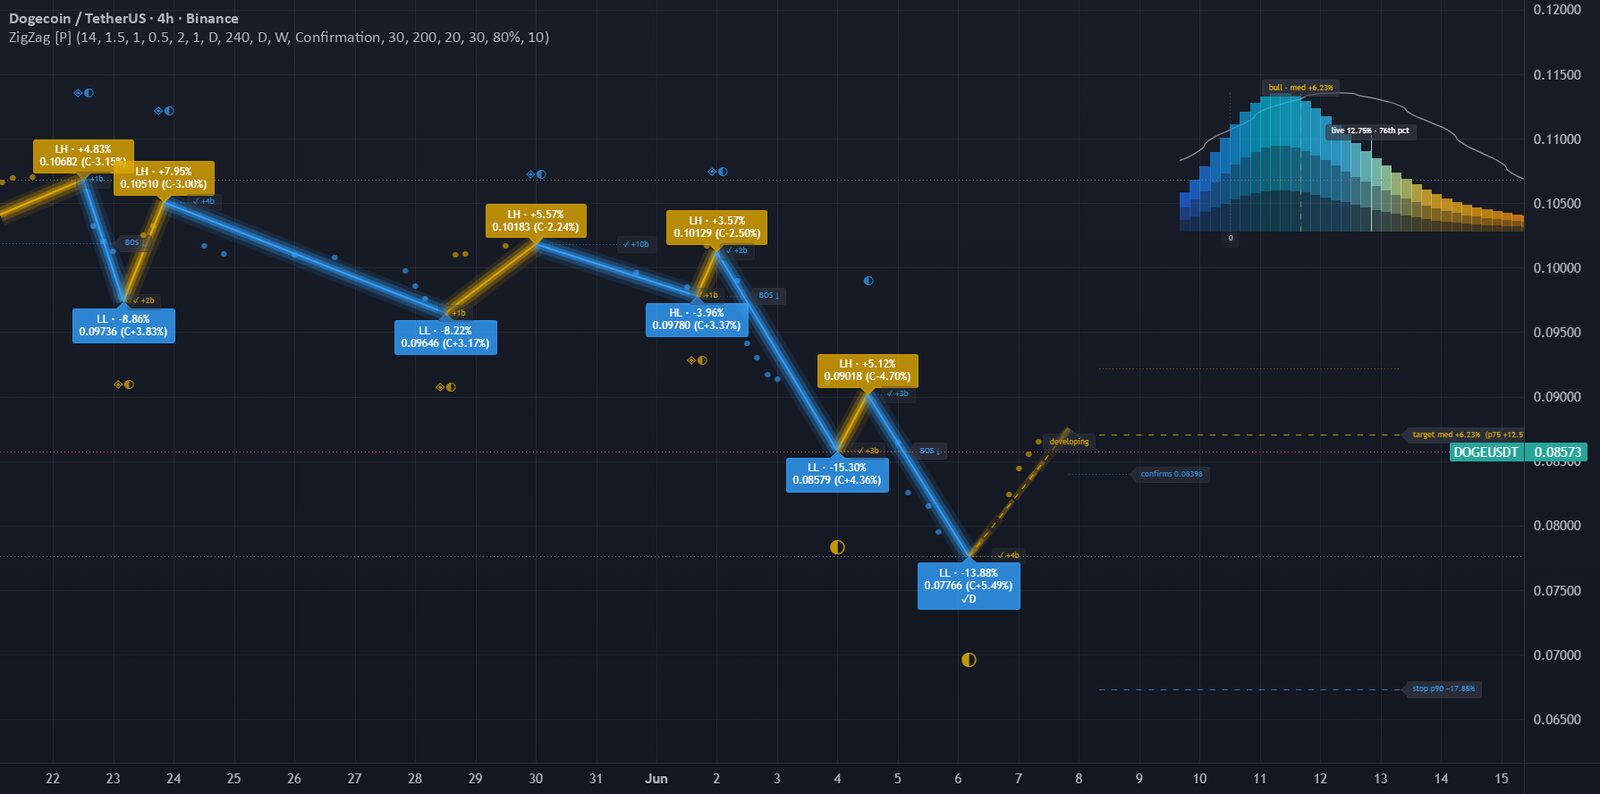
ZigZag Confluence
ZigZag Confluence
Honest swing structure — confirmed legs never redraw, the developing leg stays dashed, with per-pivot edge reads and multi-timeframe confluence.
Pivot Points Mapped
Pivot Points Mapped
Four pivot methods on an auto D/W/M grid — every level mapped with real tag- and hold-rates, higher-timeframe confluence and a CPR width read.
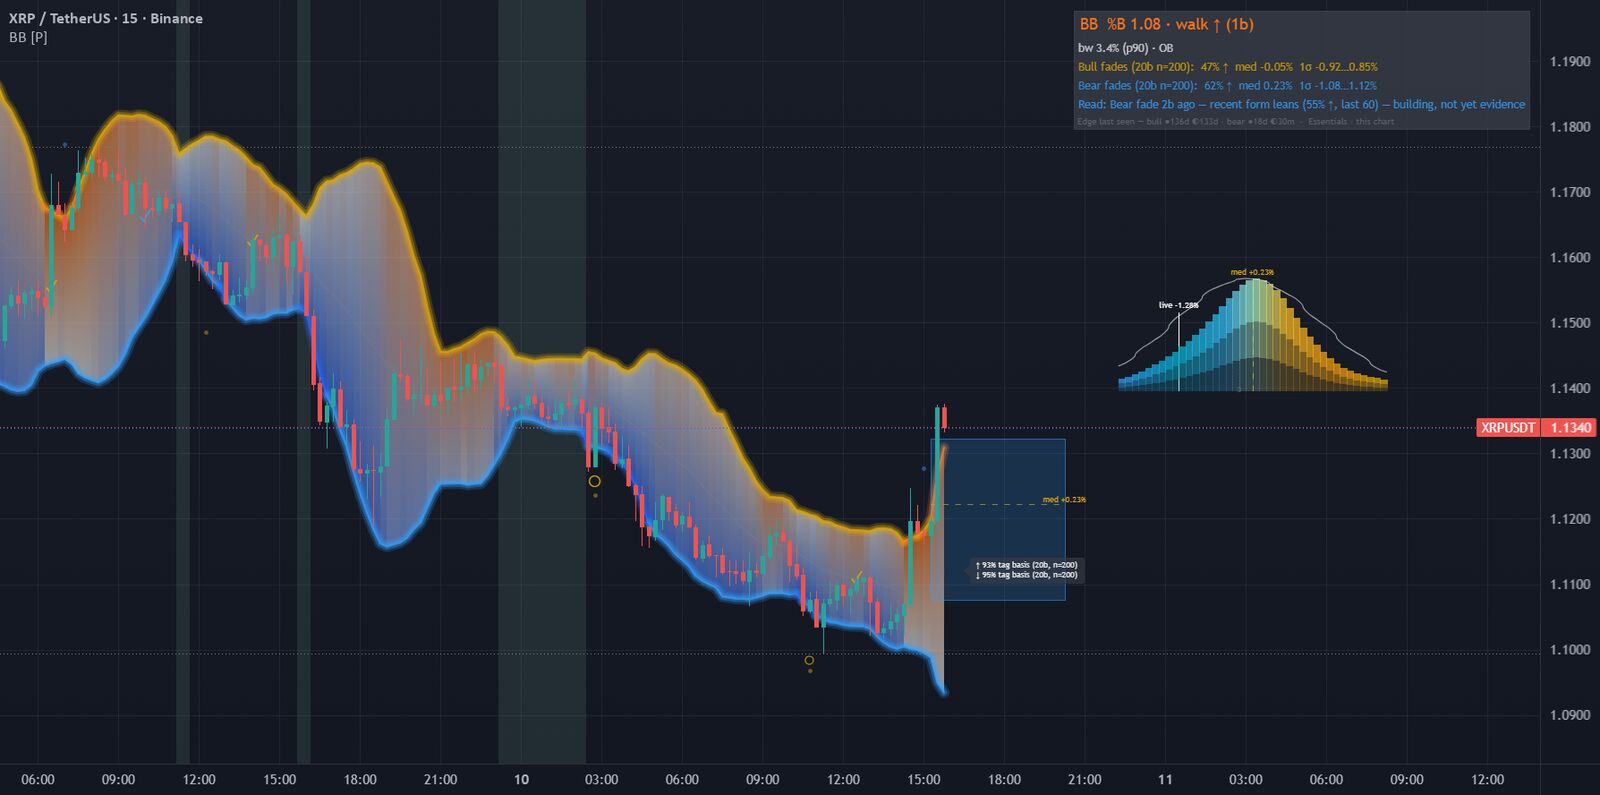
Bollinger Bands Unbound
Bollinger Bands that tell you when NOT to fade — a Band-Walk Guard suppresses fades during trends, a Reversion Map shows where past fades actually went.
BTC/USDT
ETH/USDT
SOL/USDT
XRP/USDT
BNB/USDT
DOGE/USDT
ADA/USDT
LINK/USDT
DOT/USDT
AVAX/USDT
BTC/USDT
ETH/USDT
SOL/USDT
XRP/USDT
BNB/USDT
DOGE/USDT
ADA/USDT
LINK/USDT
DOT/USDT
AVAX/USDT

Everything you need
to win the market

The classics every trader already uses — RSI, MACD, Supertrend, VWAP — rebuilt with the statistical rigour they always deserved.

01

Classics, rebuilt properly

Every Essentials indicator keeps the canonical formula intact — Wilder's RSI, the original MACD, true anchored VWAP — and adds the adaptive logic and context the originals were missing. The source is open — read every line.

02

Non-repainting by design

Signals are computed on closed bars only. What you see in a backtest is what you would have seen live — no repainting, ever.

03

Adaptive bands & regimes

Fixed 70/30 levels treat every market the same. Essentials indicators adapt their bands to recent volatility and regime, so signals stay meaningful across assets and timeframes.

04

Real-time alerts

Every signal ships as a TradingView alert condition. Set it once and get notified the moment a setup forms — on any market, any timeframe.

05

Divergence detection

Regular and hidden divergences between price and momentum are detected and drawn automatically — one of the few signals with real statistical edge.

06

Signal statistics

Indicators show the empirical forward-return distribution of their own signals on the chart you're viewing. Know how a signal has actually performed — before you trade it.


Process

Live in 3 steps

Setting up Probalist takes less than 5 minutes. No complicated configuration

01

Open a script page

Pick an indicator below and open it on TradingView. The Essentials are free and open source — no account on Probalist needed.

02

Add to your chart

Click "Add to favorites" and the indicator appears in your TradingView indicator list. One click adds it to any chart.

03

Trade with confidence

Read the indicators, set your alerts, and trade any market and timeframe with precision.


The Probalist Essentials
Free on TradingView

Classic indicators rebuilt the way they should have been — adaptive, statistical and non-repainting. 100% open source. Add them to your chart with one click; new scripts are added weekly.

Anchored VWAP Magnetized on a TradingView chart

Anchored VWAP Magnetized

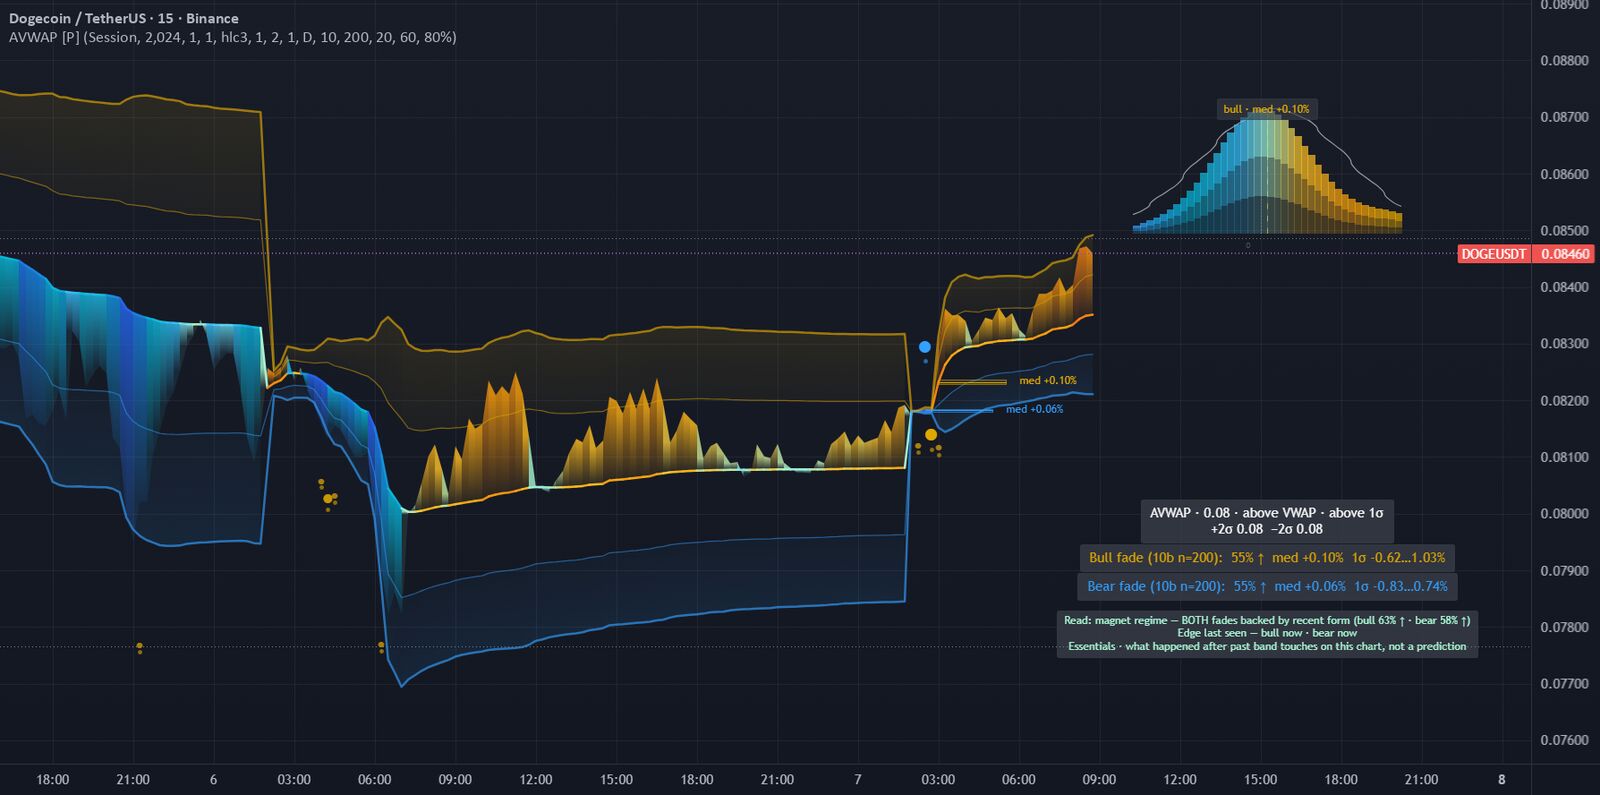
Volume-weighted average price from any anchor — session, week, month or a specific date — with ±1σ and ±2σ standard-deviation bands. Price gravitates back toward VWAP over time; the bands show you how far is too far.

View on TradingView →
Supertrend Tempered on a TradingView chart

Supertrend Tempered

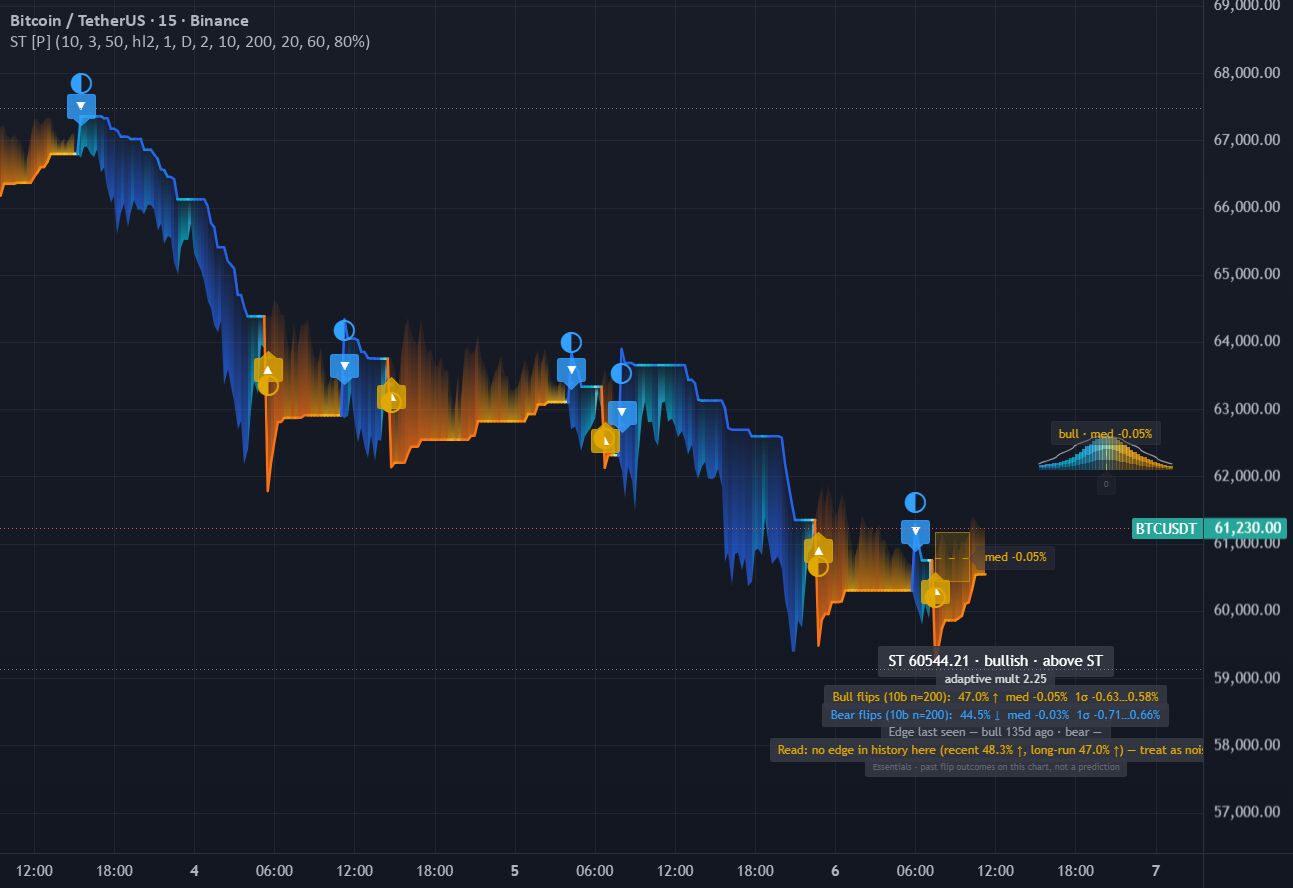
A trend-direction tool that trails an ATR stop above or below price and flips when price closes through it. Gold means the trend is up, blue means down — the flip is the signal. Tempered adds ATR-adaptive behaviour to cut the whipsaws.

View on TradingView →
MACD Rewired on a TradingView chart

MACD Rewired

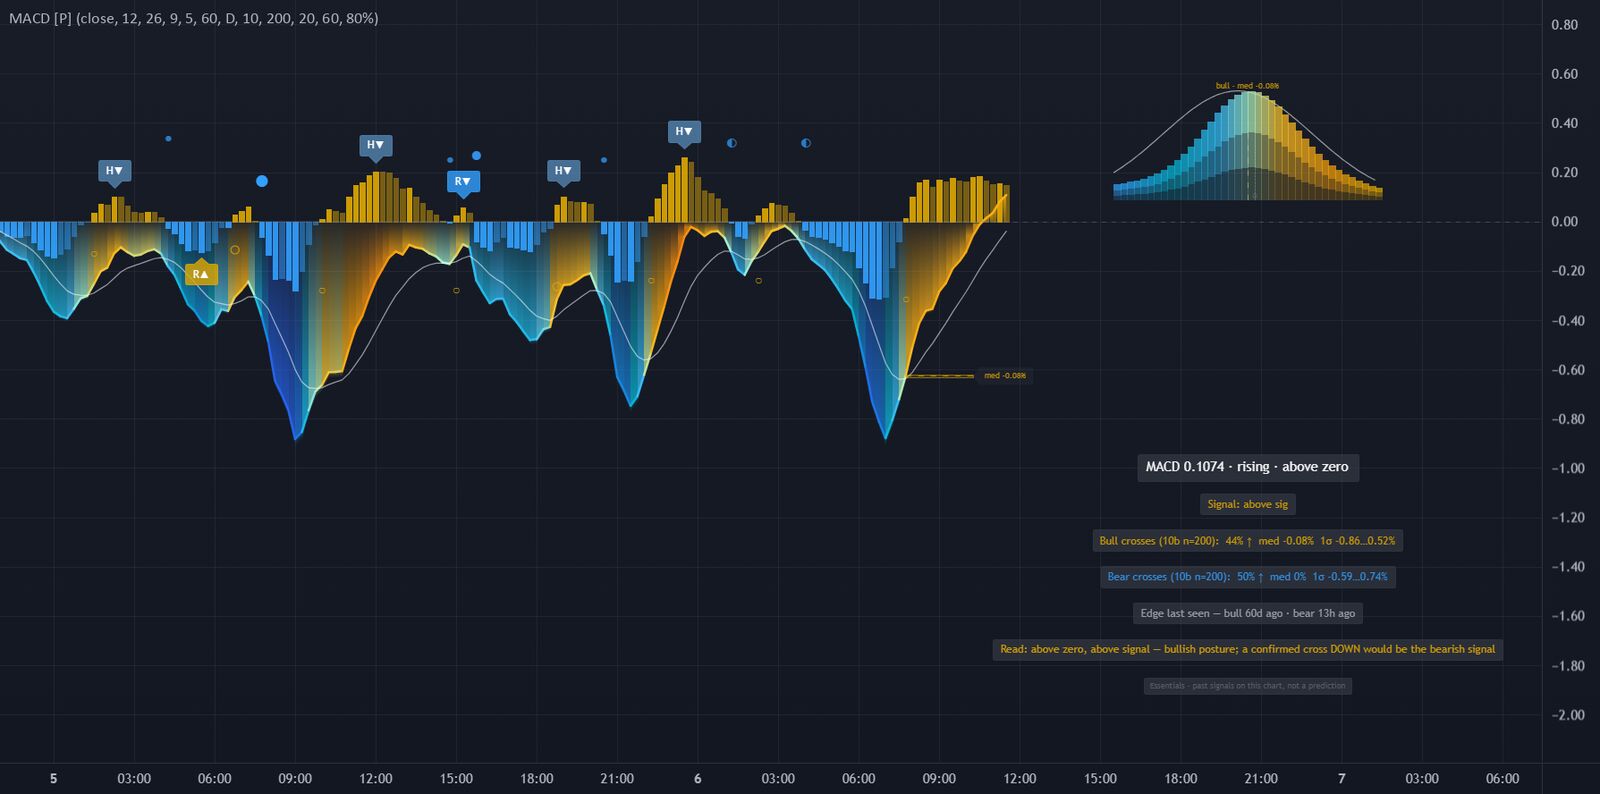
The canonical MACD — fast EMA minus slow EMA through a signal line — rebuilt with a 4-state histogram, regular and hidden divergence detection, and an empirical forward-return distribution on every signal.

View on TradingView →
RSI Reforged on a TradingView chart

RSI Reforged

The Relative Strength Index done properly for modern trading. The canonical Wilder formula stays intact — with adaptive bands, divergence detection and signal statistics added on top.

View on TradingView →
Kalman Trend Velocity on a TradingView chart

Kalman Trend Velocity

Tracks the speed of price movement through a real two-state Kalman filter — velocity estimated together with its uncertainty. A trend only counts when velocity clears its own uncertainty band; when the band straddles zero, the move is indistinguishable from noise.

View on TradingView →
ZigZag Confluence on a TradingView chart

ZigZag Confluence

Swing structure with a clear line between what is settled and what is still moving: confirmed legs are solid and never redraw, the developing leg is dashed with the confirmation lag spelled out. Each pivot carries an honest edge read — favorable run (MFE), adverse heat (MAE) and a net-return verdict with a Wilson-score lower bound — alongside evidence-gated alerts, multi-timeframe ✓-badges and HH/HL/LH/LL structure with BOS/CHoCH flagged.

Pivot Points Mapped on a TradingView chart

Pivot Points Mapped

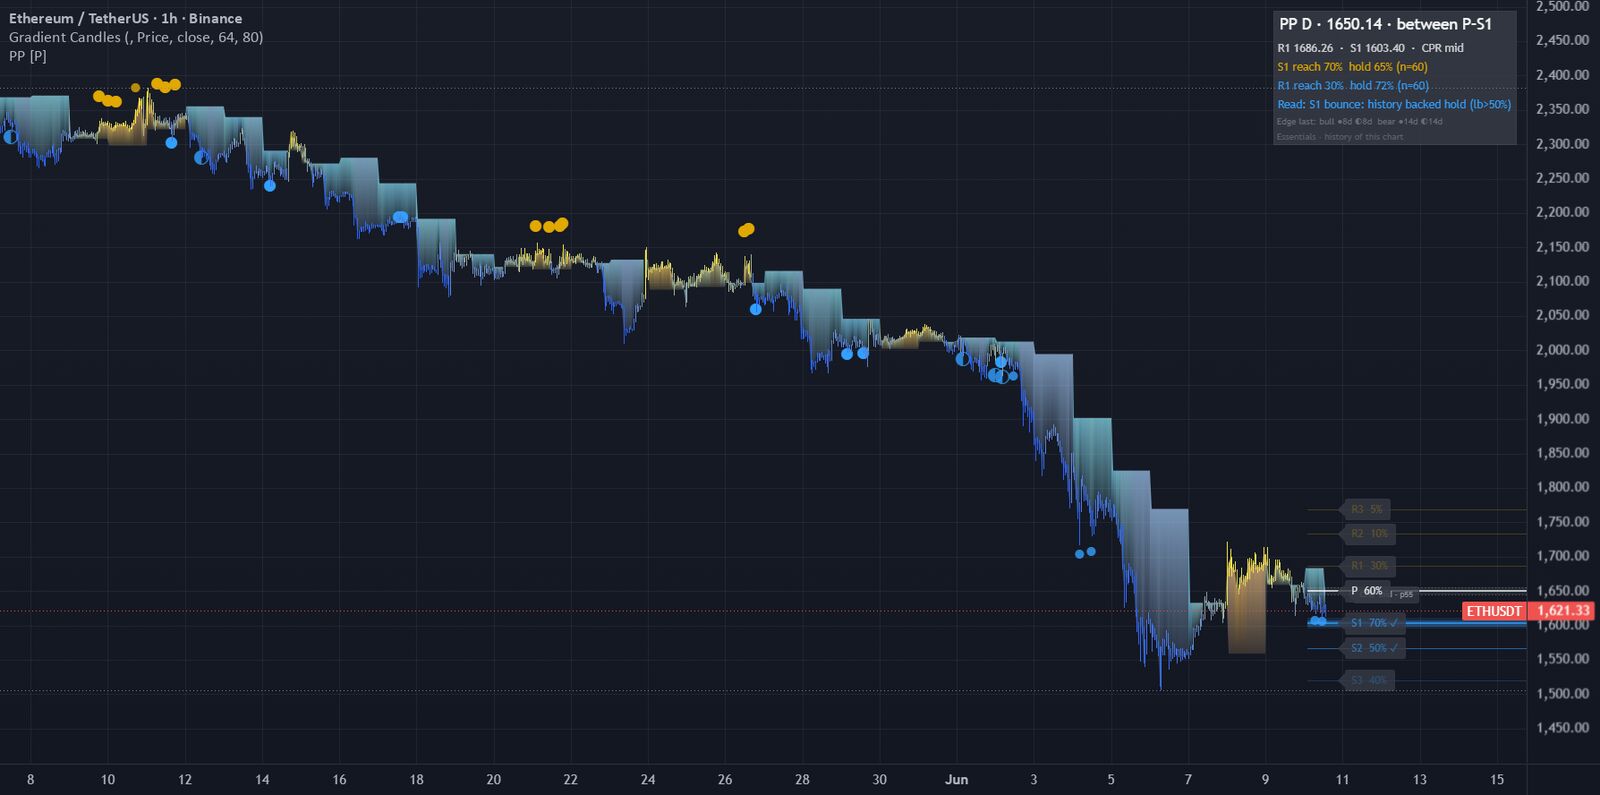
All four classic pivot methods — Classic, Fibonacci, Camarilla and Woodie — on an automatic daily, weekly and monthly grid, with a Reach Map: every level shows how often this chart actually tagged it, how often it held (with a Wilson-score lower bound) and whether a higher timeframe agrees (✦). A CPR band with a width-percentile read completes the picture, and the grid declutters itself — the bright levels are the ones that matter.

View on TradingView →
Bollinger Bands Unbound on a TradingView chart

Bollinger Bands Unbound

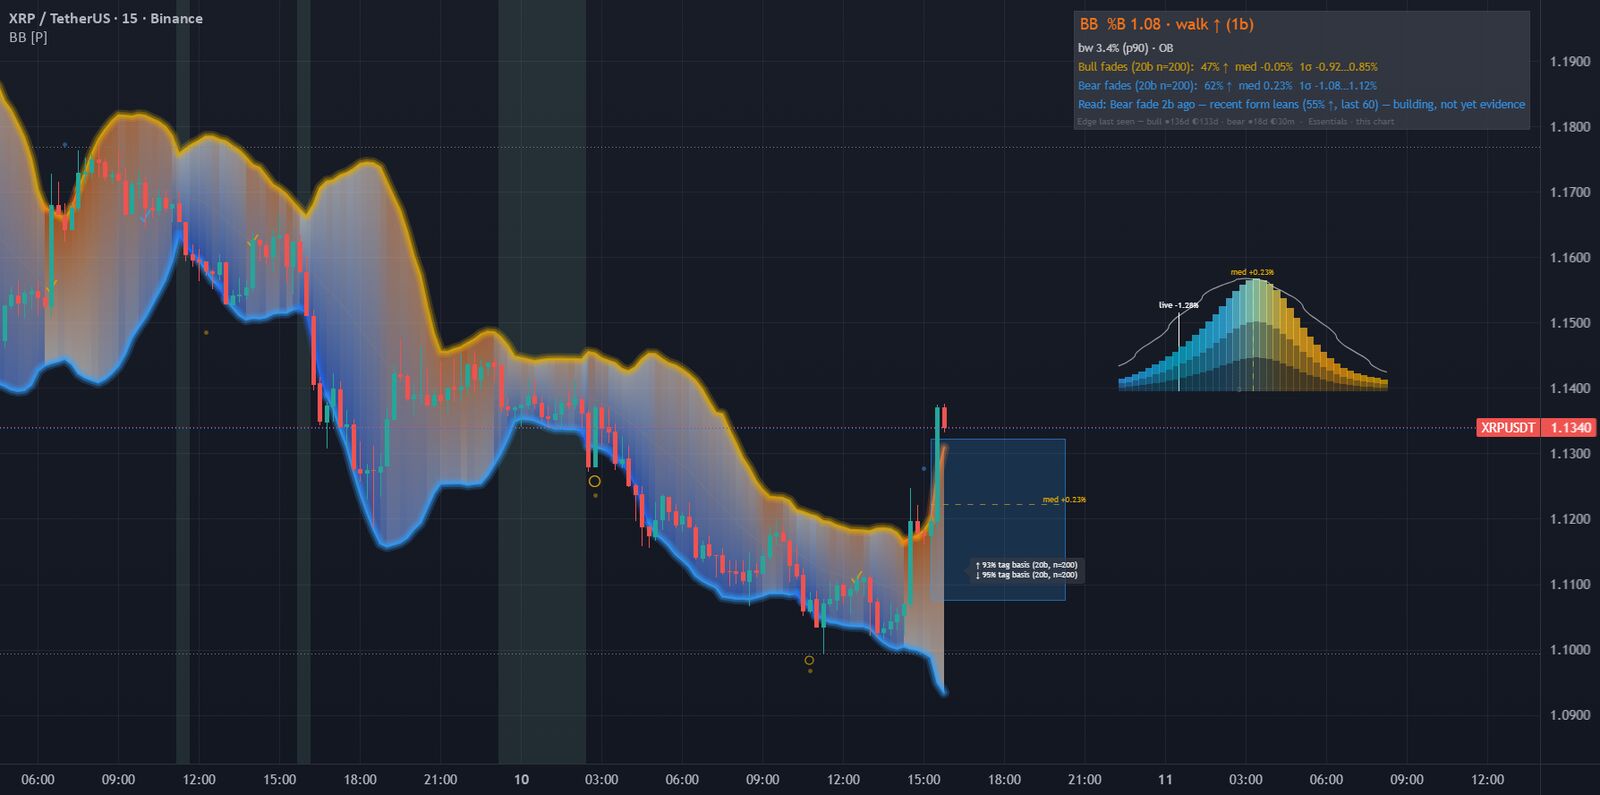
The classic Bollinger Bands, rebuilt to tell you when NOT to fade. A Band-Walk Guard flags trending excursions and suppresses fade signals while price keeps closing outside the band — so you stop fading a trend that is still running. A Reversion Map then measures where past fades actually went on this chart: basis-reach rate, forward-return distribution, median and 1σ band, recent vs long-run form. Squeeze regime is read from a self-calibrating bandwidth percentile, with evidence-gated alerts.

View on TradingView →
View all scripts on TradingView →

Premium indicators — coming soon

A closed-source VIP suite is in the works: regime detection, probability bands and more. The Essentials stay free — VIP builds on top of them.

Wins from our community

Real trades, real results from the Probalist community.

Questions & Answers

Can't find what you're looking for? Ask our AI chat.

Probalist publishes professional indicators on TradingView. Open a script page, add it to your chart and you are done. The Essentials are open source — no downloads and no account on Probalist needed.

Yes — the Probalist Essentials are free and open source. Their full Pine Script is public on TradingView, so you can read exactly what each one does. A premium, closed-source line is on the way for traders who want more, but the Essentials stay free.

Open the script on TradingView and click "Add to favorites". The indicator then appears under Indicators → Favorites on any chart — one click adds it.

All markets available on TradingView — crypto, forex, stocks, indices, commodities and more. They perform best on higher timeframes (1H, 4H, daily).

No. Signals are computed on closed bars only, so what you see in the chart history is exactly what you would have seen live. Non-repainting is a hard rule for every Probalist script.

No — and that is deliberate. The bell curve is not an entry signal; it tells you whether to trust the signal that just fired. The direction comes from the signal; the curve then shows where price actually went after that kind of signal on this chart — mass right of zero with the median above it means a real edge, mass around or left of zero means noise. It is descriptive, never a prediction — Probalist publishes tools, not buy/sell signals. (The free Academy covers how to read it in depth.)

Yes. The indicators are clean and easy to read, and every script page explains how to use it. Want the theory behind each tool? The free Probalist Academy covers it step by step.

Yes. Every signal ships as a TradingView alert condition. Set an alert once and get notified by email or in the TradingView app the moment a setup forms.

New indicators are added weekly. Follow Probalist on TradingView to get notified when a new script goes live.

Yes — a closed-source VIP suite is in development, with regime detection, probability bands and more. The Essentials stay free; VIP builds on top of them.

Ready to upgrade your charts?

All Probalist Essentials indicators are free and open source on TradingView. New scripts are added every week.

Follow Probalist on TradingView →
Free & open source · No account needed · New scripts weekly
🔒
Coming Soon

This plan is currently not available.

Join the waitlist
We will notify you as soon as this plan becomes available.
Please enter a valid email address.
🎉
You are on the list!

We will send you an email as soon as this plan launches.

Probalist© 2026 Probalist
Free indicators →